Priority view is accessed by clicking the Priority tab in the navigation bar.
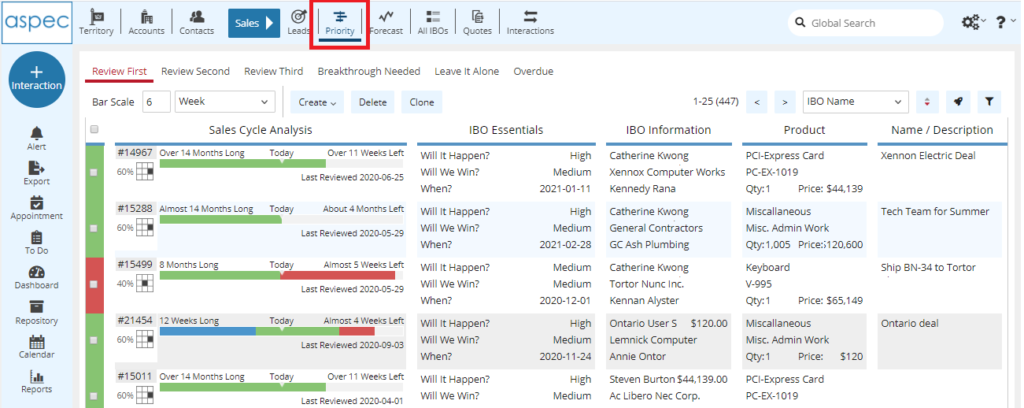
Fig 1: Priority listview
This view displays a list of all of your open sales Opportunities and can be used to prioritize your time and determine which Opportunity to focus on. The Priority view groups and displays your opportunities in six categories: Overdue, Review First, Review Second, Review Third and two special categories called Breakthrough Needed and Leave it Alone. View each of the categories by clicking the links at the top – Review First, Review Second, Review Third, Breakthrough Needed, Leave it Alone, and Overdue.
Priority displays a great deal of useful information about your open Opportunities. The list includes all of the pertinent information. You can open the detailed IBO Form by clicking on the IBO, but this usually won’t be necessary. The listview displays the Sales Cycle Analysis, showing the probability of winning this sale, the very important date the IBO was last reviewed, and the other elements of the sale. This is a list of your sales Opportunity “portfolio”. You should work it from the top to the bottom. ASPEC has done the difficult work of sorting the opportunities for you.
This list should be consulted and updated regularly. It is organized first by Priority – which is calculated from a combination of the probability that you assign and where you are in the sales cycle. Make sure to update the “IBO Essentials” regularly to make sure that ASPEC assigns these priorities correctly. If you do that, you will be sure that you can work your list from top to bottom with confidence that you are putting your efforts to the best effect.
Buttons and other view components
The view actions contain the following elements:
1.Priority selector: Select a Priority to view all IBOs in that Priority
2. Bar Scale: Here you can change the scale of all of the Sales Cycles. Type a number in the box, and select Day/Week/Month/Year.
3. Standard buttons: based on the User’s privileges
4. Paging: click < or > to move to the previous or next page
5. Sorting: select how to sort the view
6. Filter: saved Preset and the Filter
IBO List
The listview contains the following columns:
1. Color-coded Phase: blue for Probe, green for Prove, and red for Close. This column also acts as the IBO selector, for example for exporting selected IBOs.
2. Sales Cycle Analysis: Starting from the left, the column displays the IBO Number, Probability the Probability Matrix, and a graphical sales cycle representation of the Sales Cycle. You can change the scale of all the Sales Cycles by typing in the number in the Bar Scale menu and/or o changing the Units from Days, Weeks, Months, or Years. This column also displays a Sales Cycle Graph. Note that depending on the bar scale, you may not be able to see the entire Sales Cycle.
3. IBO Essentials: Displays user’s assessment of the probability of winning and the expected close date.
4. IBO Information: Displays the IBO Owner, the name of the Account and Contact and Total Price
5. Last/Next: Last Interactions and next task or appointment, linked to this IBO. This column has to be enabled by the ASPEC Administrator.
6. Product: Displays the Product Group, Product, Quantity and the Total Price for that Product
7. Description: Short Description
Columns in this view are not customizable.
This listview displays rows of data, based on the Filter. Usually, users do not want to look at all records. Please read this post about filters, exports, and reports. The first screen displayed once ASPEC is opened is the Sales Cycle Planner view. This view displays a list of all of your open sales opportunities and can be used to prioritize your time and determine which opportunity to focus on. Sales Cycle Planner prioritizes and displays your opportunities in six categories: Overdue, Review First, Review Second, Review Third and two special categories called Breakthrough Needed and Leave it Alone.
The Sales Cycle Planner view displays a great deal of useful information about your open opportunities. The Sales Cycle Planner view shows the opportunities grouped by priority. This is a list of your sales opportunity “portfolio”. You should work it from the top to the bottom. ASPEC has done the difficult work of characterizing the opportunities for you.
This list should be consulted and updated regularly. It is organized first by PRIORITY – which is calculated from a combination of the probability that you assign and where you are in the sales cycle. Make sure to update the “IBO Essentials” regularly to make sure that ASPEC assigns these priorities correctly. If you do that, you will be sure that you can work your list from top to bottom with confidence that you are putting your efforts to the best effect.
Starting from the left, you can see the IBO Number, Probability the Probability Matrix, and a graphical sales cycle representation of the Sales Cycle. Each IBO has a Sales Cycle that is split up in three phases – the longest portion is the Probe Phase, the second longest is the Prove Phase, and the shortest is the Close Phase. You can change the scale of all the Sales Cycles by increasing or decreasing the number in the Bar Scale menu. It is also, possible to change the Units from days, weeks, months, or years depending on the length of the Sales Cycle.
The Probe phase is shown in Blue, the Prove phase in Green, and the Close phase in Red.
The arrow shows today’s date in relation to the entire Sales Cycle.
- Bar Scale: Here you can change the scale of all of the Sales Cycles. Type a number in the box, and select Day/Week/Month/Year.
- Probability: This shows the IBO Number, Probability, and the Probability Matrix.
- Sales Cycle: This is the graphical representation of the Sales Cycle. The full length stretches from the start of the Probe Phase (in blue), through the Prove Phase (in green), to the end of the Close Phase (in red). Today is always represented right in the middle. Note that depending on the bar scale, you may not be able to see the entire Sales Cycle.
- Sales Cycle Length: This is an approximation of the entire length of the Sales Cycle.
- Time Left: This is roughly the time left before the Sales Cycle ends.
- Last Reviewed: Here you can quickly see the last time this IBO was modified, or interaction was entered for this IBO.
The rest of the columns are configured to match your business requirements. For instance, you might see IBO Essentials, IBO Information, and Product Information.