Forecasting projects how much revenue your company will be receiving, in order to determine how resources should be allocated, what purchases should be made from suppliers, and what strategic moves should be made. Forecasting is normally done at regular intervals such as monthly, quarterly, etc.
The Sales Forecast listview allows to view a forecast summary of IBOs by expected close data and categorized by month, quarter, or year.
Additionally, the Filter to the Forecast narrows down to a specific set of IBOs. This can be extremely useful for sales meetings, or for a manager to drill into a specific territory, product line or any other category. Please read this post about filters, exports and reports.
Finding Forecast listview
Open the Sales Forecast form by selecting Forecast tab from the menu at the top right of the screen.

Fig 1: Forecast tab
Selecting Forecast parameters
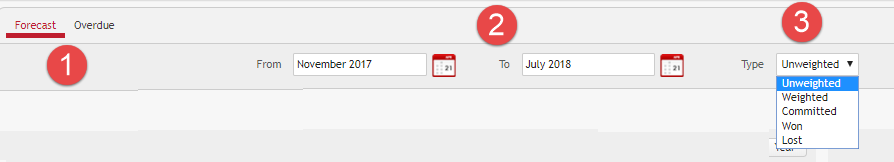
Fig 2: Date Range and Forecast Type
First, users decide if they want to exclude or examine Overdue IBOs (Open IBOs where the expected close date already passed). By default Forecast applies to Open IBOs with the expected close date in the future.
The date range (2) is used to define the period of time for the forecast view. Select the From Month and To Month by clicking the Calendar icon and choosing a month.
Select the Type (3) to determine how to display the value for each IBO.
If Unweighted is selected, the total value for all IBOs will be used.
If Weighted is selected, forecasting takes sales Probability into consideration. Weighted price is equal to the total price multiplied by the Probability percentage for this Opportunity.
If Committed is selected, only IBOs that have the ‘Committed’ value selected will display a value. If Won or Lost is selected, only Won or Lost IBOs will be displayed.
Lost IBOs do not belong to the Forecast, but we added the ability to view past Lost IBOs in this view, as requested by our customers.
Graph Pane
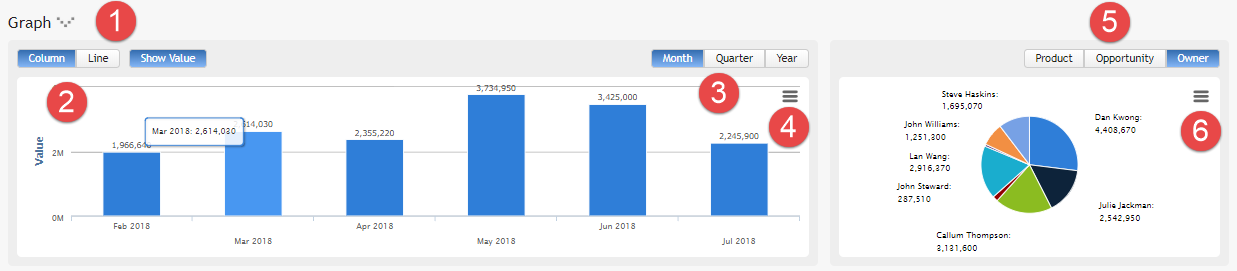
Fig 3: Graph pane
The Graph pane displays all IBOs in the selected date range by month graphically in two charts.
The chart on the left is a Bar Chart, and the chart on the right is a Pie Chart. You can optionally group the data by Product, Product Group, or Owner.
You can collapse or expand (1) this pane to view the IBOs in the selected date range by month graphically in two charts. The chart on the left is a Bar Chart or a Line Chart (2). You can group the data by Month, Quarter or Year (3). Clicking a button(4) prints or downloads the graph.
The chart on the right is a Pie Chart. Data can be grouped by Product, Product Group, or Owner (5). Clicking a button (6) prints or downloads the chart.
IBO List Pane
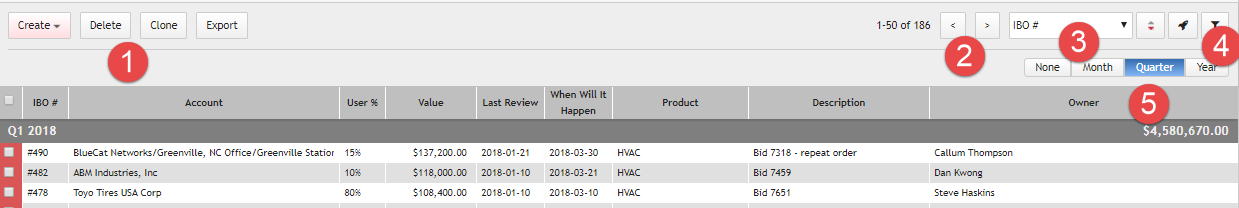
Fig 4: Data view
This section shows the IBOs for the defined date range. The first column shows the phase of the IBO (Probe: blue, Prove: green, Close: red). If the IBO is overdue, it will be displayed in yellow and black diagonal lines. In addition, the row for the overdue IBO will be coloured in red.
At the top users see standard buttons (1), based on their privileges. They can move to the next page(2) and sort (3), filter (4), and group (5) by Month, Quarter, Year, or None.
The IBOs are sorted by selecting a value in the top right – note that this sort will apply within the groupings. For instance, if the IBOs are grouped by Month, but sorted by Company; the IBOs will be sorted by Company in each group.
You can apply the Global Filter to the Forecast view to see forecast information for a specific Role or a specific User in your organization. This can be extremely useful for sales meetings, or for a manager to drill into a specific sales person’s forecast.
You can Export the IBO data for any forecast that you are currently viewing by clicking the Export button in the Sidebar. Note that the ability to export for a user is defined in the Setup/Users.
Overdue Tab
The Overdue tab shows you a list of any IBOs who’s WWIH (“When Will It Happen?”) expected close date has passed. The Global Filter applies to this tab, if set.